FPS Estimation Tools and the Limits of Pre-Build Performance Prediction
Knowing their limits helps builders use FPS calculators wisely.

FPS estimation tools help show how well a planned build is likely to run a game before the parts are bought. They are planning aids whose predictions carry no performance guarantee. Their limits follow from how they turn hardware specifications into predictions, and understanding those limits makes the numbers more useful.
What FPS estimation tools actually do and how they produce a number
An FPS calculator estimates the frame rate for a chosen set of hardware, game, resolution and graphics settings. It does not run that proposed machine. Instead, a model uses benchmark data and component scores to work out how well the chosen parts should perform.
TechSavant makes its calculation more explicit. Its model estimates separate CPU-bound and GPU-bound limits for each game, then takes the lower result. The slower side sets the pace. Resolution, graphics preset and optional upscaling scale the GPU side, while a shortage of video memory triggers a penalty. The tool also displays a VRAM tag so that the memory constraint is visible.
That mechanism gives builders a way to compare parts without owning them. But it also compresses a complicated gaming session into a small set of inputs and scaling rules. A benchmark anchor can improve the model without making it a live test. The predictable limits begin with that distinction.
The accuracy band every tool agrees on, and what it means for threshold decisions
The major FPS estimation tools describe broadly similar accuracy margins around measured averages for common CPU and GPU pairings. A predicted average has room to move. That room could change the buying decision.
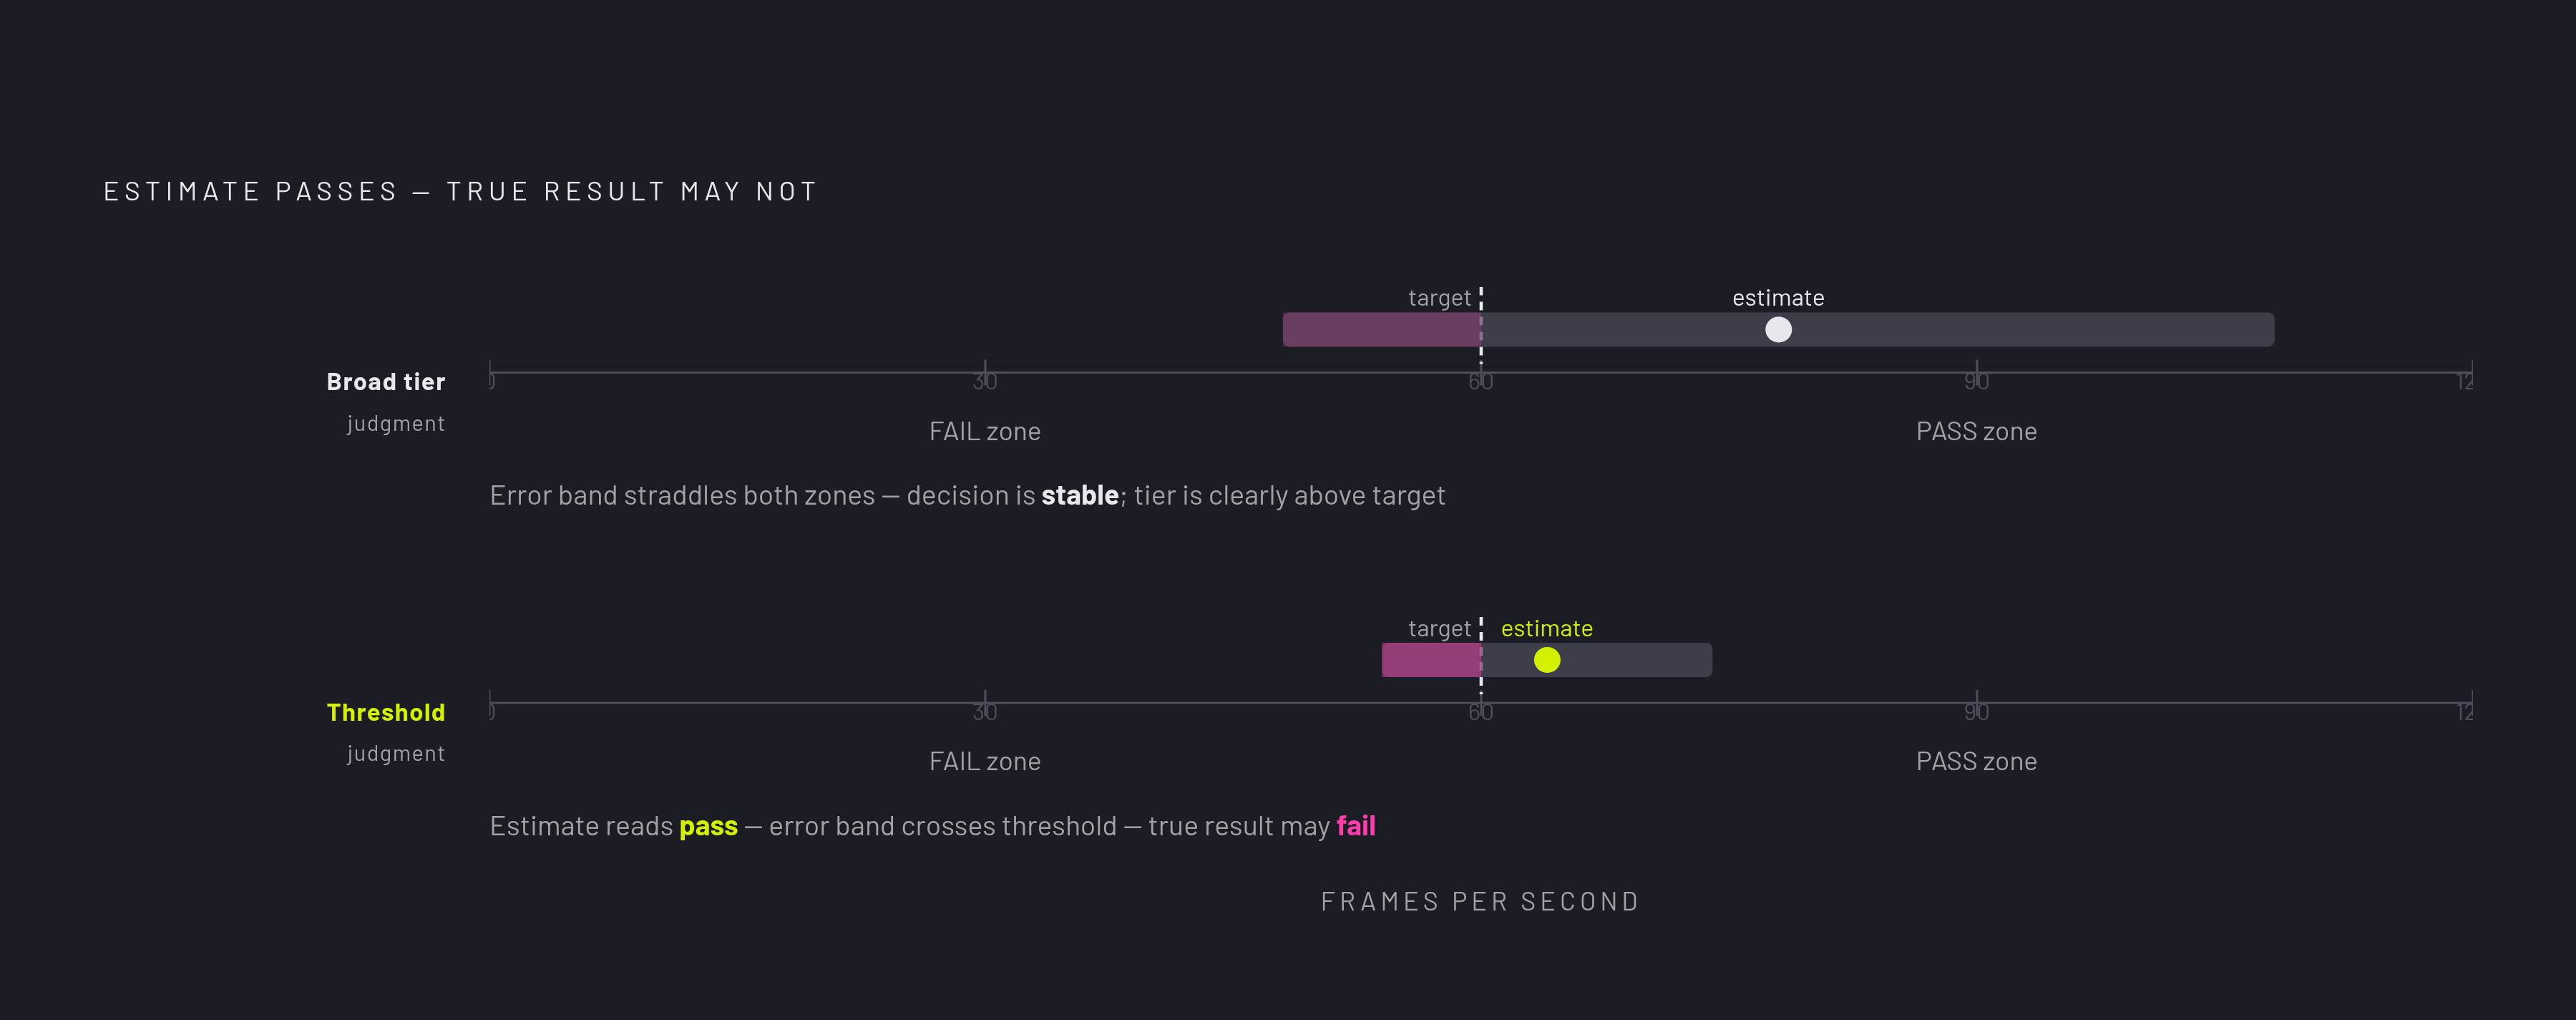
For broad performance tiers, some uncertainty is tolerable because a build can remain clearly unsuitable or clearly capable. A marginal target is less forgiving. When an estimate is just above the frame rate a builder would accept, a normal error in the prediction can put the actual result below that rate. The model may still be performing within its stated accuracy band while giving the builder the wrong basis for a yes-or-no decision.
This is why the same tool can be useful for choosing a class of hardware and weak at certifying a particular target. The decision changes even though the calculation does not. A broad judgment asks where a build belongs, while a threshold judgment asks which side of a narrow line it will land on.
The variables that fall entirely outside what any pre-purchase model can capture
Some differences between estimated and actual FPS come from conditions the model never represents. TechBenchPro and PC Tech Kits both say their calculations leave out background processes. Discord, browser tabs, streaming software and monitoring utilities use CPU resources and RAM that a clean benchmark does not account for. Under that added load, the estimate is likely to look optimistic.
Explosions, dense geometry and changes between scenes can produce sharp drops that an average conceals, including in esports titles. Smoothness is not contained in one average. A build with a high average can feel worse than one with a lower average that delivers frames at a steady pace. Differences between Vulkan, DirectX and OpenGL add another layer that a static model cannot fully represent for each game.
When VRAM fills, stuttering can occur regardless of the GPU’s raw computing power, especially in modern AAA games at 1440p and above on cards with limited memory. A penalty to the number alone cannot show how that stuttering feels. Similarly, a GPU that performs well in a short benchmark can throttle during sustained gaming if cooling is insufficient. More reference data may refine a prediction, but it cannot tell the calculator which background load, scene or thermal state a particular session will reach.
Why frame generation is the largest blind spot in current FPS estimates
Frame generation creates a larger mismatch because it changes what the displayed FPS number represents. The GPU renders real frames, while frame generation adds displayed frames without a proportional increase in rendering workload. Native FPS and displayed FPS therefore diverge. A calculator can give a fair native-rendering estimate that is still far below the frame rate shown in a game that supports frame generation.
Upscaling does not close this gap because it is a separate technology with a separate effect. TechSavant offers an upscaling range for Quality and Performance modes using DLSS, FSR or XeSS, but explicitly states that frame generation is not modelled. A builder who treats the upscaling toggle as covering both technologies will read more into the result than the tool provides.
There is also a condition attached to the apparent gain. Frame generation needs a sufficiently high base frame rate to work well, because the neural networks used in current implementations can produce artifacts at low base rates. A low native estimate may thus show a weak starting point without showing why frame generation would do a poor job of fixing it. Knowing that the tool quotes native figures makes its output interpretable, whether frame generation is supported and enabled or does not apply at all.
How the installed base has shifted, and why that changes what the estimates are benchmarked against
Valve’s Steam Hardware Survey shows a shift toward higher-resolution displays and larger memory configurations, with 1440p now the second-most-common primary display resolution, 16GB graphics cards moving ahead of 8GB cards, and 32GB replacing 16GB as the most common system RAM capacity. Those population changes affect what a typical reference build should represent. A model anchored to an older norm can fall behind the hardware people are planning to buy.
A tool calibrated mainly around 1080p reference builds may treat 1440p as a scaled departure from its baseline, even as more players treat it as their starting point. Memory assumptions can age in the same way. A typical system configuration is not a permanent reference, and treating 16GB of RAM as the norm now represents something other than the most common configuration.
The VRAM shift also changes expectations for upcoming games. With 16GB becoming the most common tier, the expectation in the brief is that 2026 and 2027 AAA releases will increasingly treat 12GB as an effective floor for recommended settings, rather than that being a universal requirement already established. Calibration dates therefore deserve attention as context.
Valve's crowdsourced framerate estimator and why a different data foundation changes what's possible
Valve’s Framerate Estimator, now in beta, uses data from real gameplay in place of a synthetic performance model. That is a different foundation for prediction. Measurements from real hardware running real games can show what happens where component scores and scaling rules can only give an estimate. In principle, this gives the estimator a more direct basis for describing what similar systems achieve.
The estimator depends on opt-in participation, so games with smaller player bases may initially have less reliable results or no estimate at all. New releases face a cold-start problem. It is also not confirmed whether the estimator accounts for resolution and quality settings, which are essential context for interpreting a frame rate. Without that context, a measured result can be just as difficult to apply to a proposed build as a synthetic result without resolution controls.
Valve has not announced an official launch date. Futuremark’s Game-o-meter on YouGamers was an earlier tool for predicting performance, but it used 3DMark benchmark scores in place of actual in-game frame rates. 3DMark also shows expected FPS in some games after a benchmark run in its paid Advanced Edition and Professional Edition. The distinction lies in the evidence underneath the estimate.
How to use FPS estimates productively and the right questions to bring to them
Start with whether a build belongs in the right performance tier for the chosen game, resolution and preset. Rule out builds that are clearly too weak, and take clearly strong results as a broad sign that a build will do the job. Treat the middle band as uncertain. An estimate sitting at a marginal target is a reason to revisit component selection or settings expectations.
Comparisons are especially useful when the resolution and preset stay fixed. Compare proposed builds under those same conditions, because the relative difference is more dependable than either absolute figure. TechSavant has a side-by-side compare mode for this. Its CPU-bound and GPU-bound tags also help identify which component is likely to limit a particular game, while TechBenchPro pairs its FPS calculator with a bottleneck calculator. Use that distinction to judge whether a GPU or CPU upgrade is likely to make the games being played run better.
Apply the upscaling toggle when the intended setup will use DLSS, FSR or XeSS. Native figures are the wrong expectation for a build planned around upscaling. For supported frame-generation games, read native FPS as the base from which displayed output may rise. A weak base rate still needs attention.
Assessing gameplay smoothness requires 1% lows and frame-time consistency, while performance with the builder’s background software running requires assessment under that load.
Where compatibility checking and 3D visualization fill the gaps FPS estimation leaves open
Compatibility checking addresses a different part of the plan because it works from specifications. Socket match, chipset compatibility, RAM type, PSU adequacy and GPU clearance are checks with definite requirements. Physical fit comes before expected gaming performance. Cards from different manufacturers can use the same GPU chip while differing in length, so a case that clears one version may not clear another. An FPS estimate based on the chip cannot settle that question.
Fit also connects to cooling, though clearance alone does not prove thermal performance. A physical configuration that cannot provide adequate airflow can leave a GPU throttling under sustained load, undermining the expected result. Memory warnings serve a similarly distinct role. An explicit VRAM flag explains a constraint that a reduced FPS figure can obscure, especially when the likely consequence is stuttering.
3D visualization addresses the arrangement of the parts and the appearance of the finished build. Seeing a GPU at scale inside a case makes clearances easier to understand than isolated dimensions on a specification sheet. It can expose a cooler interfering with a RAM slot or a GPU crowding a cable route. Those are not frame-rate questions at all. For a build planned around tempered glass, RGB coordination or visible cable routing, visual simulation shows how it will look, which an FPS calculator was never designed to do.